
Dental Charting: The Odontogram
Chart conditions, restorations, and bridges on a full-mouth odontogram with anatomical and box views.
The Chart Is the Mouth on Paper
The odontogram is the one screen that answers "what is the state of this mouth?" at a glance — every filling that exists, every caries you found, every extraction you plan. It is also where treatment planning starts: planned marks flow into treatment plans, completed procedures flow back from the Case Record, and the chart's history remembers who charted what, and when. Charting is editable by dentists and the clinic owner; everyone else sees a read-only chart and can still click teeth to view their images.
Setting Up Your View
Four controls, top of the chart:
- Dentition — Adult, Child, or Mixed. It opens on Mixed so an erupting mixed dentition never hides anything; switch to Adult for a cleaner view on adult patients.
- Numbering — FDI, Universal, or Palmer. FDI is what's stored (quadrant + position, e.g. 16 = upper right first molar); the others are display conversions, so pick whatever your school taught you.
- Show — filter marks by All, Existing, Planned, or Completed. "Planned" is effectively your working treatment list; "Completed" is the audit view.
- Style — Anatomical (realistic tooth images with colored surface dots) reads better chairside; Box (a 3×3 surface grid per tooth) reads better for surface-precise documentation.
Reading the Colors
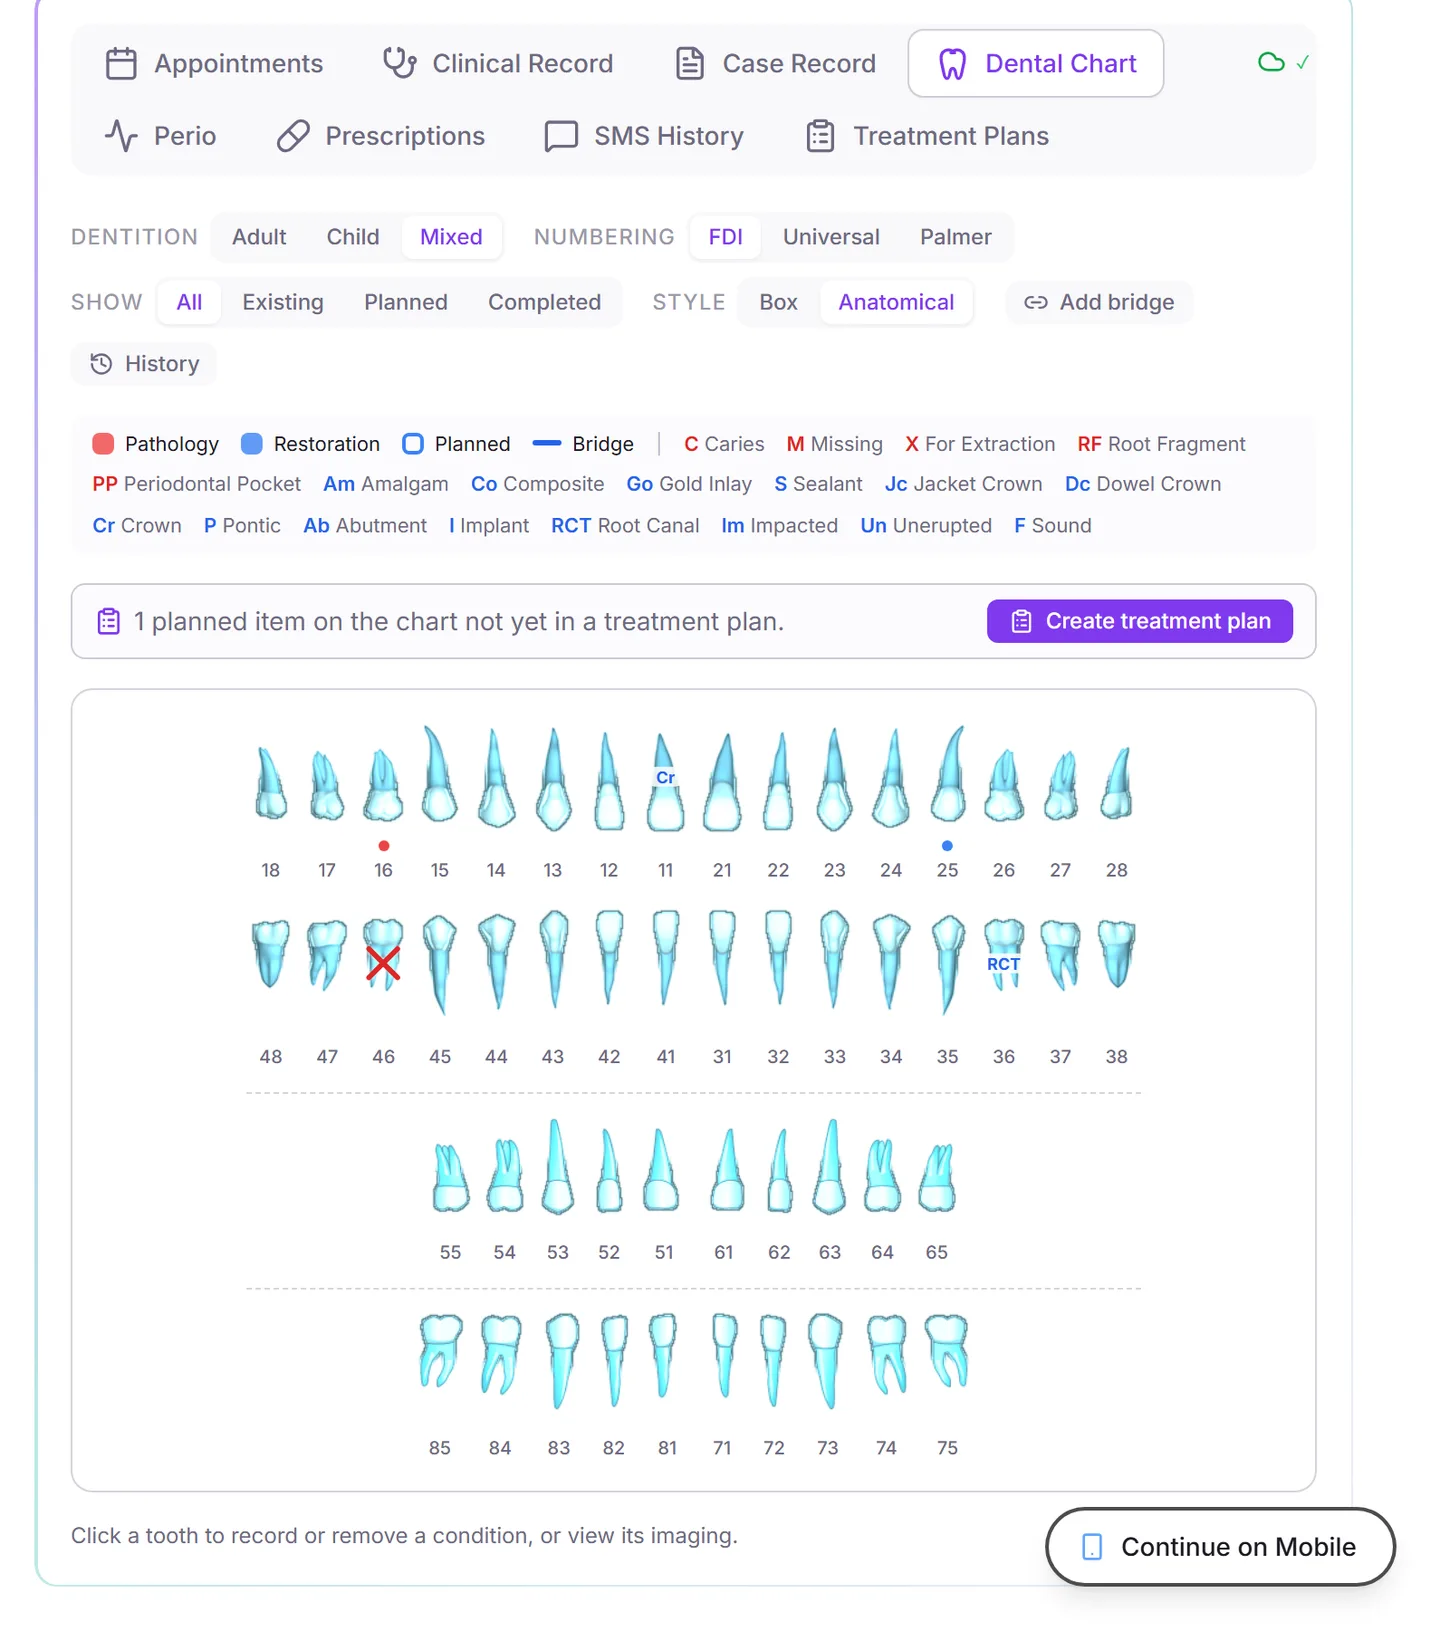
The chart speaks a two-color language. Red is pathology: caries, missing, for extraction (drawn as a red X over the crown), root fragment, periodontal pocket. Blue is restoration and status: amalgam, composite, gold inlay, sealant, crowns of every type, pontic, abutment, implant, root canal, impacted, unerupted, sound. A filled mark is existing; a ring outline is planned. A blue bar spanning teeth is a bridge. One surface can hold several findings — recurrent caries under an old filling is the classic — and pathology draws on top so trouble is never hidden. Every abbreviation is decoded in the legend right below the chart.
Charting a Finding
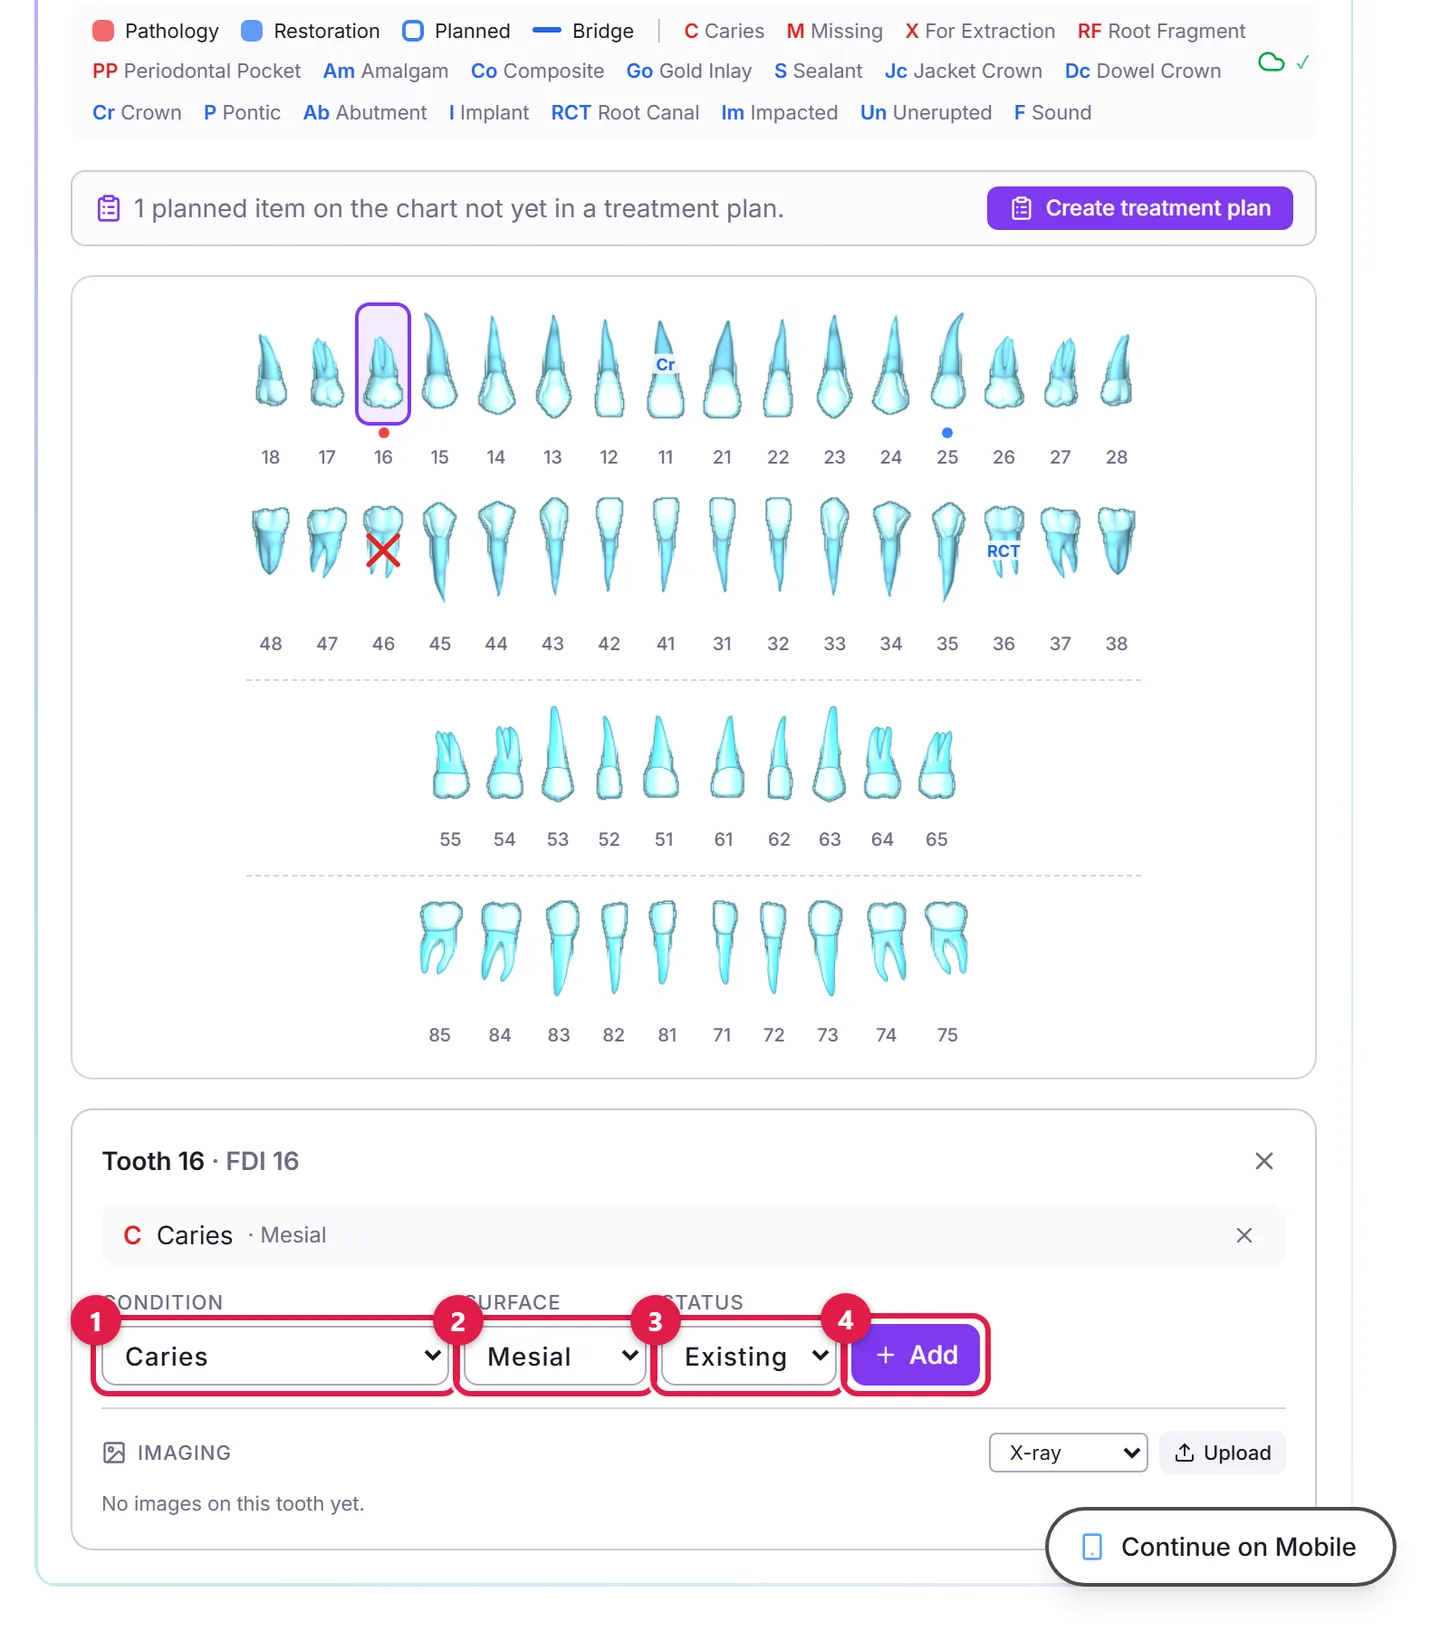
In the Tooth Editor: ① Condition — what you observed or plan, grouped into Pathology (red) and Restoration/status (blue). ② Surface — appears only for surface-level conditions like caries or fillings; pick mesial, distal, occlusal/incisal, buccal, or lingual. ③ Status — Existing (already in the mouth) or Planned (work to do); planned marks draw as a ring and can be swept into a treatment plan. ④ Add — stamps the mark on the tooth; each mark added here also appears in the chart history with your name and the time.
- Click the tooth — the Tooth Editor opens with the tooth's number in the title.
- Pick the Condition.
- For surface-level conditions, choose the Surface — mesial, distal, occlusal (posterior) or incisal (anterior), buccal, lingual.
- Set the Status — Existing or Planned.
- Click Add, and repeat for the next finding. Remove any mark with the X beside it; duplicates are rejected so you can't double-chart a tooth.
A practical rhythm for a new-patient exam: walk quadrant by quadrant charting everything Existing first (the mouth as found), then do a second pass marking Planned work. That keeps clinical findings and your treatment intent cleanly separated.
Conditions vs Procedures — Two Different Records
The chart records the state of the mouth; the Case Record tab records work you performed, with dates, materials, and photos. When a planned chart item is treated and recorded in the Case Record, the chart mark moves to Completed on its own. So: diagnose on the chart, treat in the Case Record, and let the two stay in sync — don't chart a "composite, existing" to mean "I just placed this"; record the procedure instead.
From Chart to Treatment Plan

Whenever planned marks aren't part of a plan yet, a banner counts them and offers Create treatment plan — one click drafts a plan carrying those items and links you straight to it, where you add phases, costs, and dates. This is the fastest honest way to quote a patient: chart what you found, click once, price it.
Bridges
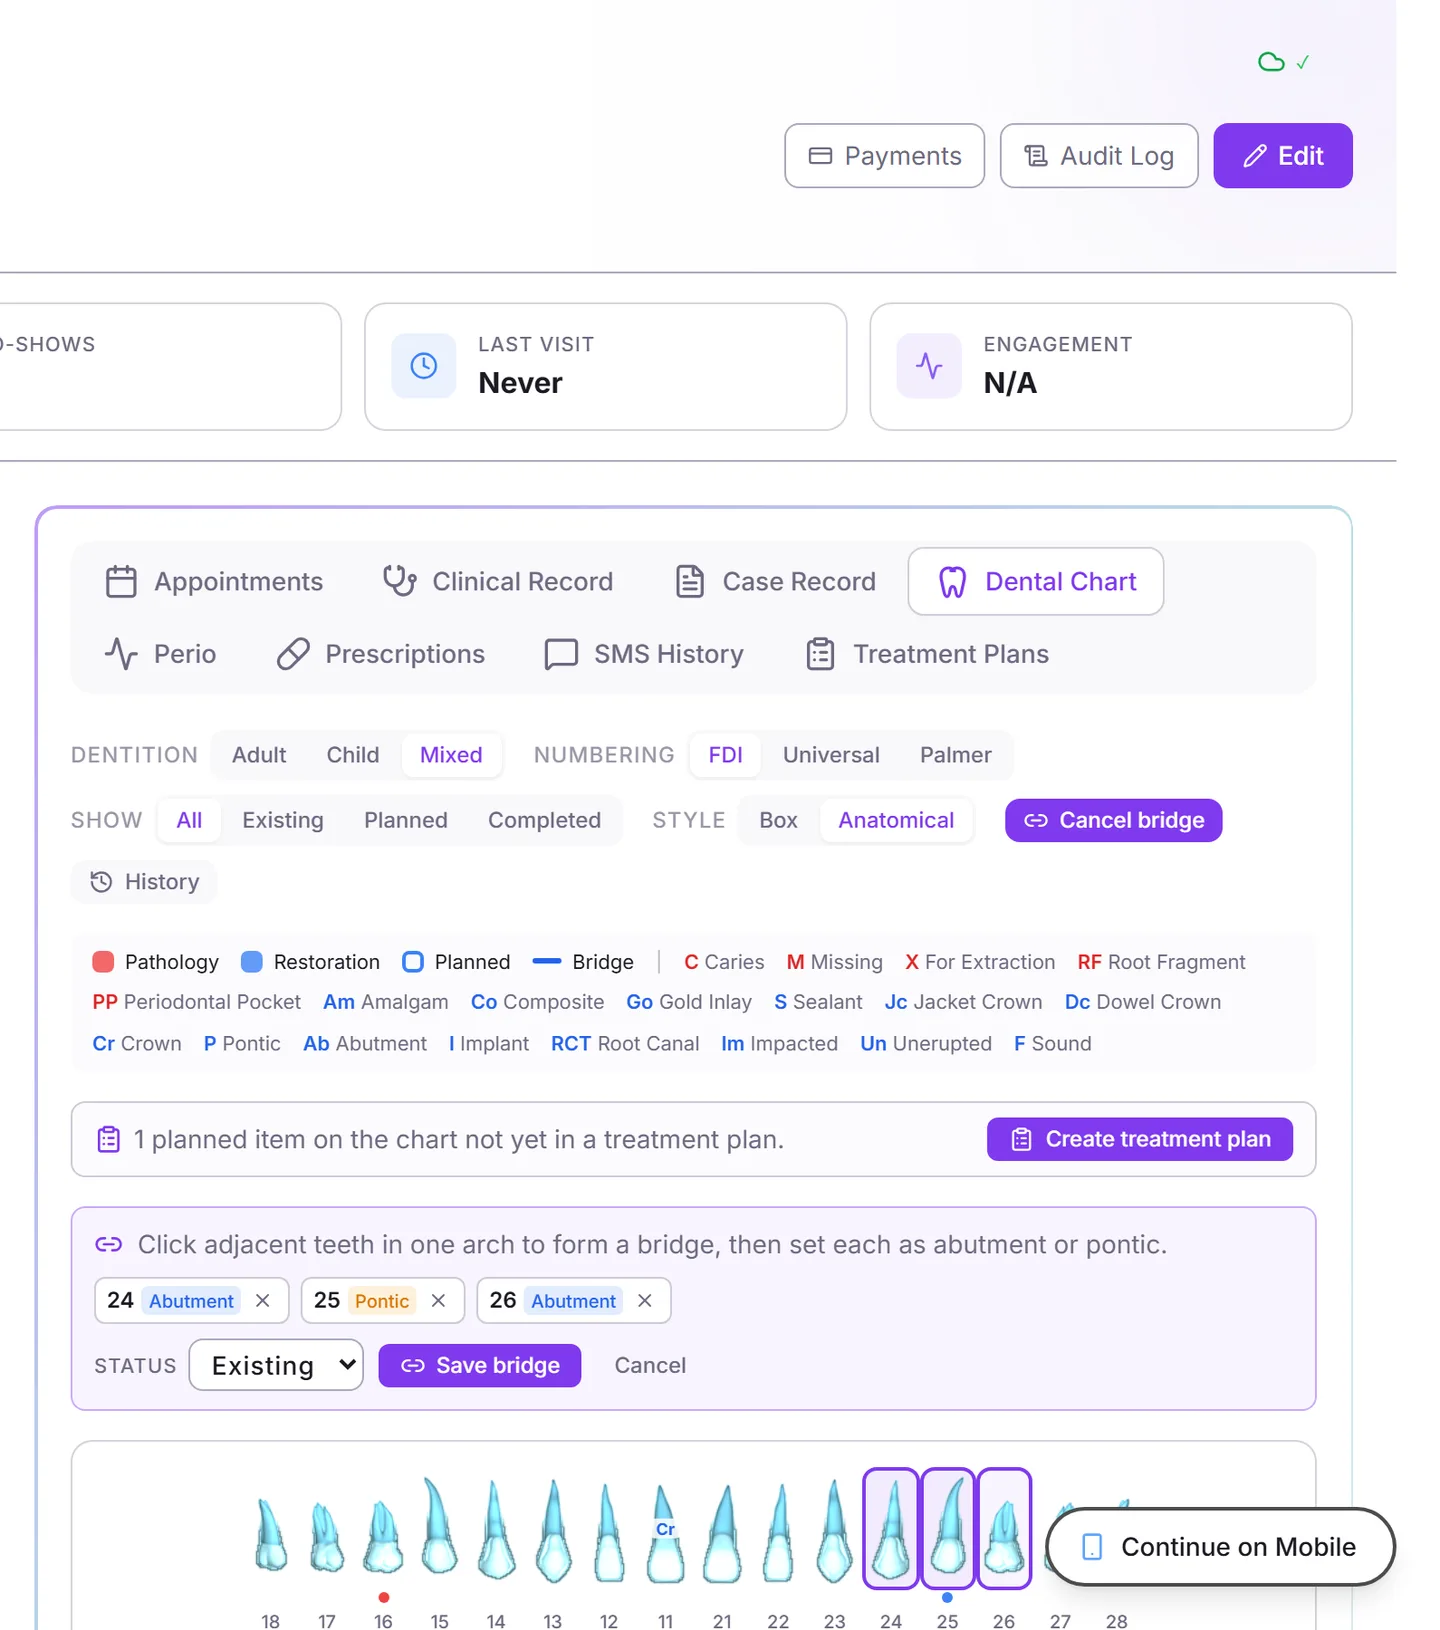
Click Add bridge, then click adjacent teeth in the same arch — the chart validates that units are contiguous. Tap each tooth's chip to toggle Abutment / Pontic (ends default to abutment), set Existing or Planned, and Save bridge. Bridges are one unit: removing any member removes the whole span, so re-chart rather than partially edit.
Time Travel
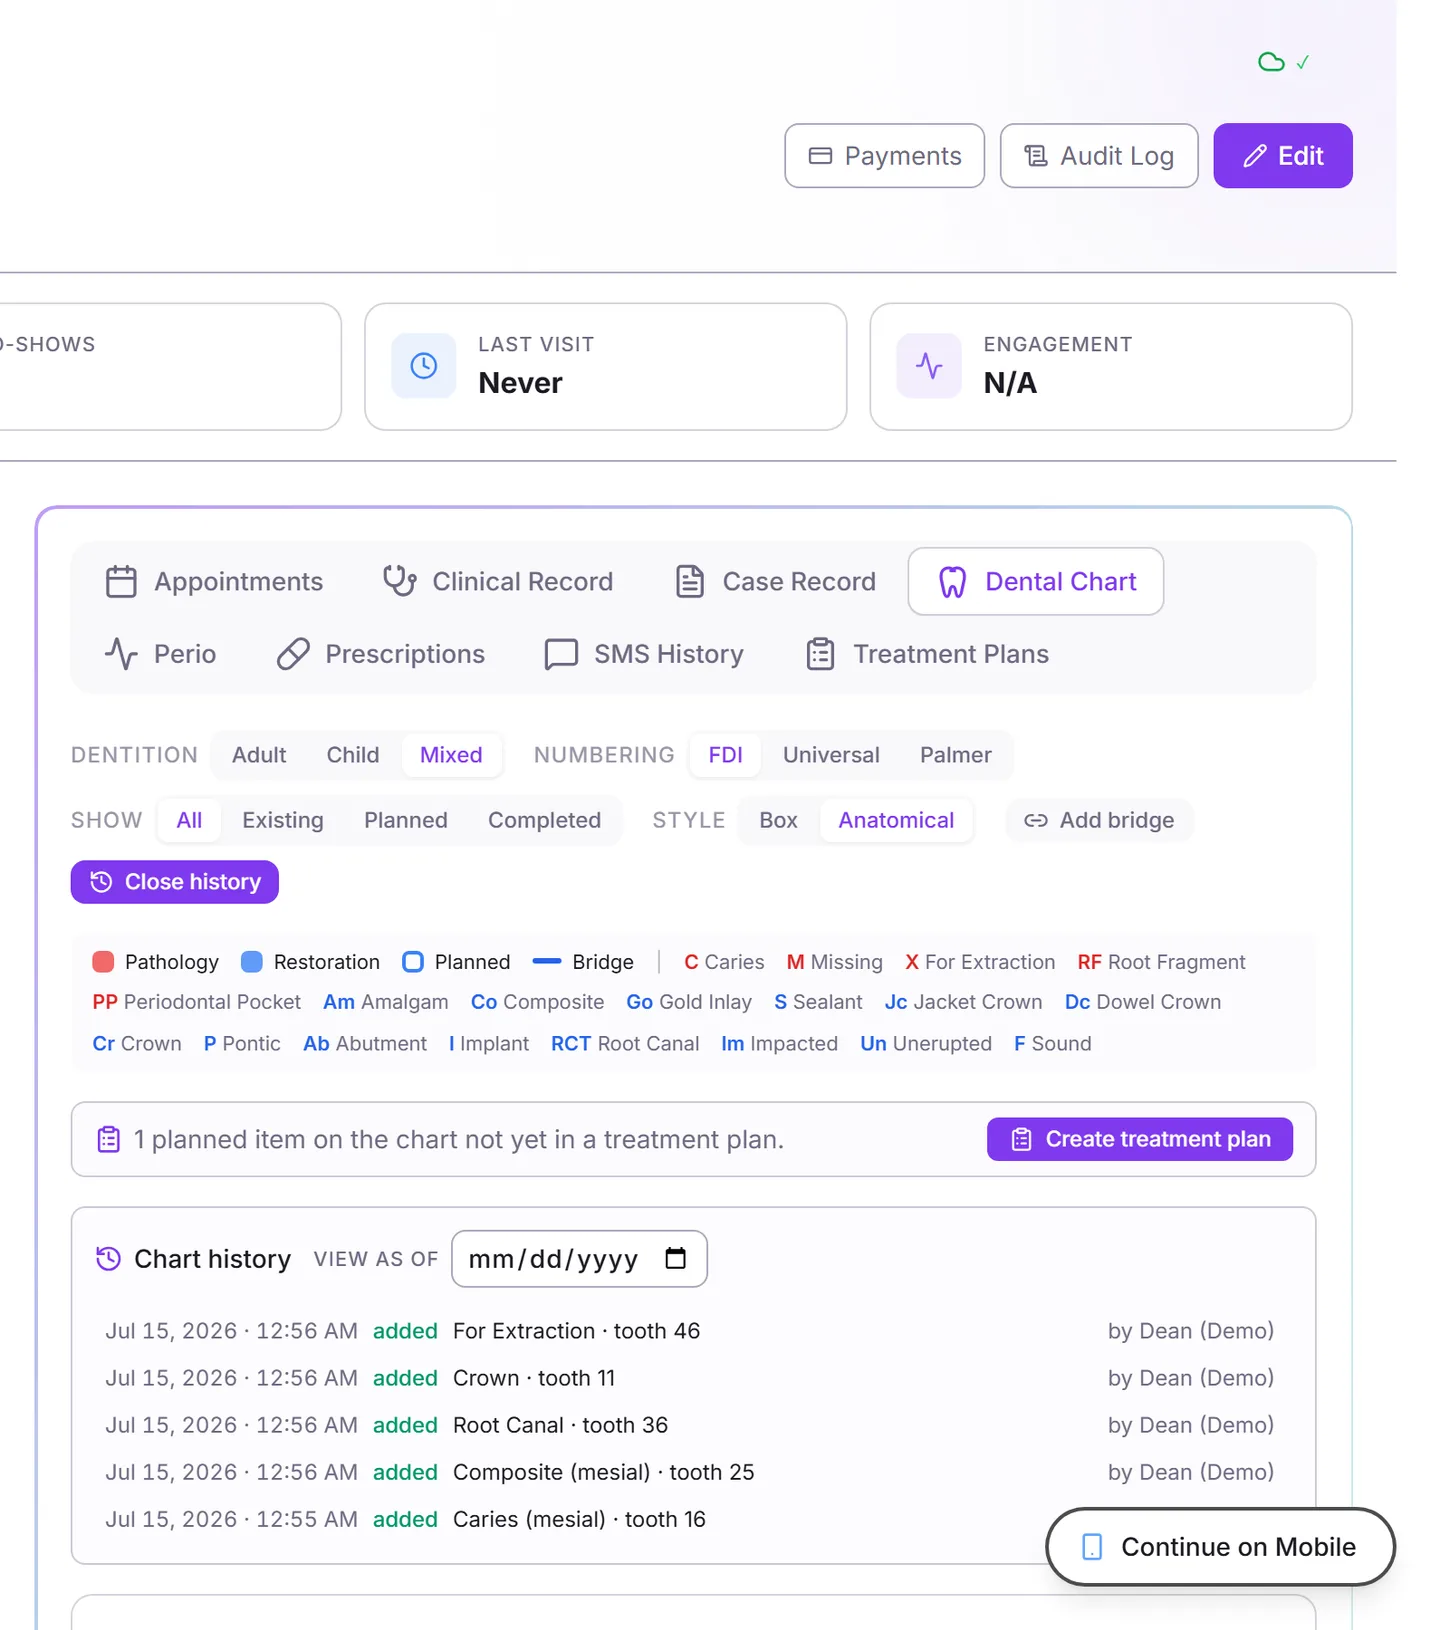
Click History for the chart's change log — every mark added or removed, by whom, and when. Click any event, or pick a date under View as of, and the chart re-draws exactly as it stood at the end of that day, read-only, until you click Back to today. This is your answer to "was that crown already charted when we saw her in March?" — and in a dispute, it's evidence.
Tooth Photos
Teeth with images carry a small camera badge. Open the tooth and use the Tooth Images panel to attach intraoral photos or radiograph crops per tooth — before/after pairs live with the procedure in the Case Record, while per-tooth images here document the finding itself.
Was this article helpful?
Need more help? Contact our support team