
Periodontal Charting
Record perio exams with per-site pocket depths, bleeding on probing, recession, and automatic summaries.
Why Chart the Gums
Cavities live on teeth; gum disease lives in the pockets around them — and pockets are invisible until you probe. A perio chart turns each probing visit into numbers, and the story is in how those numbers change: a 5 mm pocket today is a finding, but a 5 mm pocket that was 3 mm last visit is a disease in motion. Chart a baseline for every adult patient, then re-chart after treatment and at recalls.
Reading the Chart
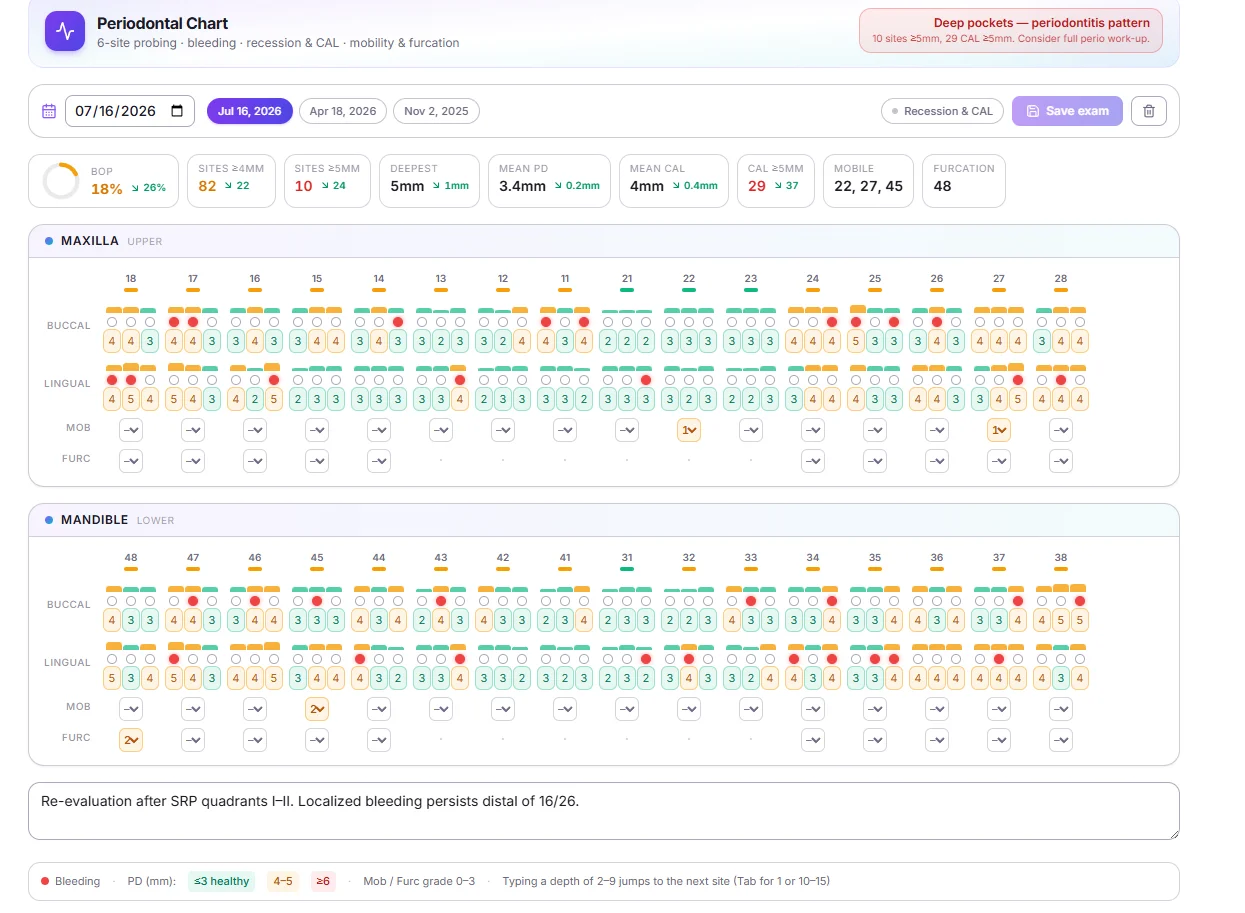
- Two tables: Maxilla (upper) and Mandible (lower), each tooth in FDI numbering.
- Each tooth has 6 sites — a Buccal row and a Lingual row of three boxes each, entered left to right just as you walk the probe.
- Above each depth box sits a small bleeding dot — tap it when the site bleeds on probing; it turns red.
- Depth boxes color themselves as you type: green ≤3 mm (healthy sulcus), amber 4–5 mm (early pocketing), red ≥6 mm (deep pocket).
- Mob and Furc rows take a per-tooth grade of 0–3; furcation applies to molars.
Your First Exam, Step by Step
- Open the patient's Perio tab and check the exam date (defaults to today).
- Click the first buccal box of tooth 18 (or wherever you start) and begin probing.
- Type each depth as you go — the cursor advances automatically (next section).
- Tap the bleeding dot on any site that bleeds; add suppuration in detailed mode.
- Set Mob and Furc grades where you found mobility or furcation involvement.
- Write a short exam note — e.g. "Baseline before SRP" or "Re-eval after SRP quadrants I–II."
- Click Save exam. "Unsaved changes" shows in amber until you do, and the browser warns you before leaving a half-finished exam.
Probing at Speed
The chart is built for the rhythm of real probing: type a depth of 2–9 and the cursor jumps to the next site by itself — no clicking, no Tab. Only the edge cases need Tab: a depth of 1, or depths of 10–15 (type both digits, then Tab). Walk the probe, call the numbers, type with your free hand — or have your assistant type while you probe. A full mouth goes fast once you trust the auto-advance.
Recession & CAL
Click Recession & CAL to expand each tooth into the detailed rows (BOP·Sup / PD / Rec / CAL):
- Recession (Rec) — millimeters of root exposed where the gum has migrated down.
- CAL (clinical attachment loss) is computed for you: CAL = PD + recession. This is the number that matters most, because a 4 mm pocket with 3 mm of recession has lost 7 mm of attachment — much worse than the pocket alone suggests.
- Suppuration — the amber dot next to bleeding, for sites expressing pus.
Reading the Summary Chips
The chips above the tables recalculate live as you chart, and each shows a trend arrow versus the previous exam — down is good for every perio metric:
- BOP — the hero tile: percent of sites that bled. It is the single most-watched perio index; rising BOP means inflammation is winning.
- Sites ≥4 mm / ≥5 mm — how many sites have pocketing, and how many are getting serious.
- Deepest / Mean PD — worst pocket and the average across all charted sites.
- Mean CAL / CAL ≥5 mm — attachment picture (in detailed mode).
- Mobile / Furcation — the tooth numbers carrying mobility or furcation grades.
The Screening Banner
The banner at the top reads your charted numbers and names the pattern:
- Healthy gingiva — BOP under 10% and no pockets ≥4 mm.
- Localized inflammation — BOP 10%+ or any 4 mm site: watch and re-probe.
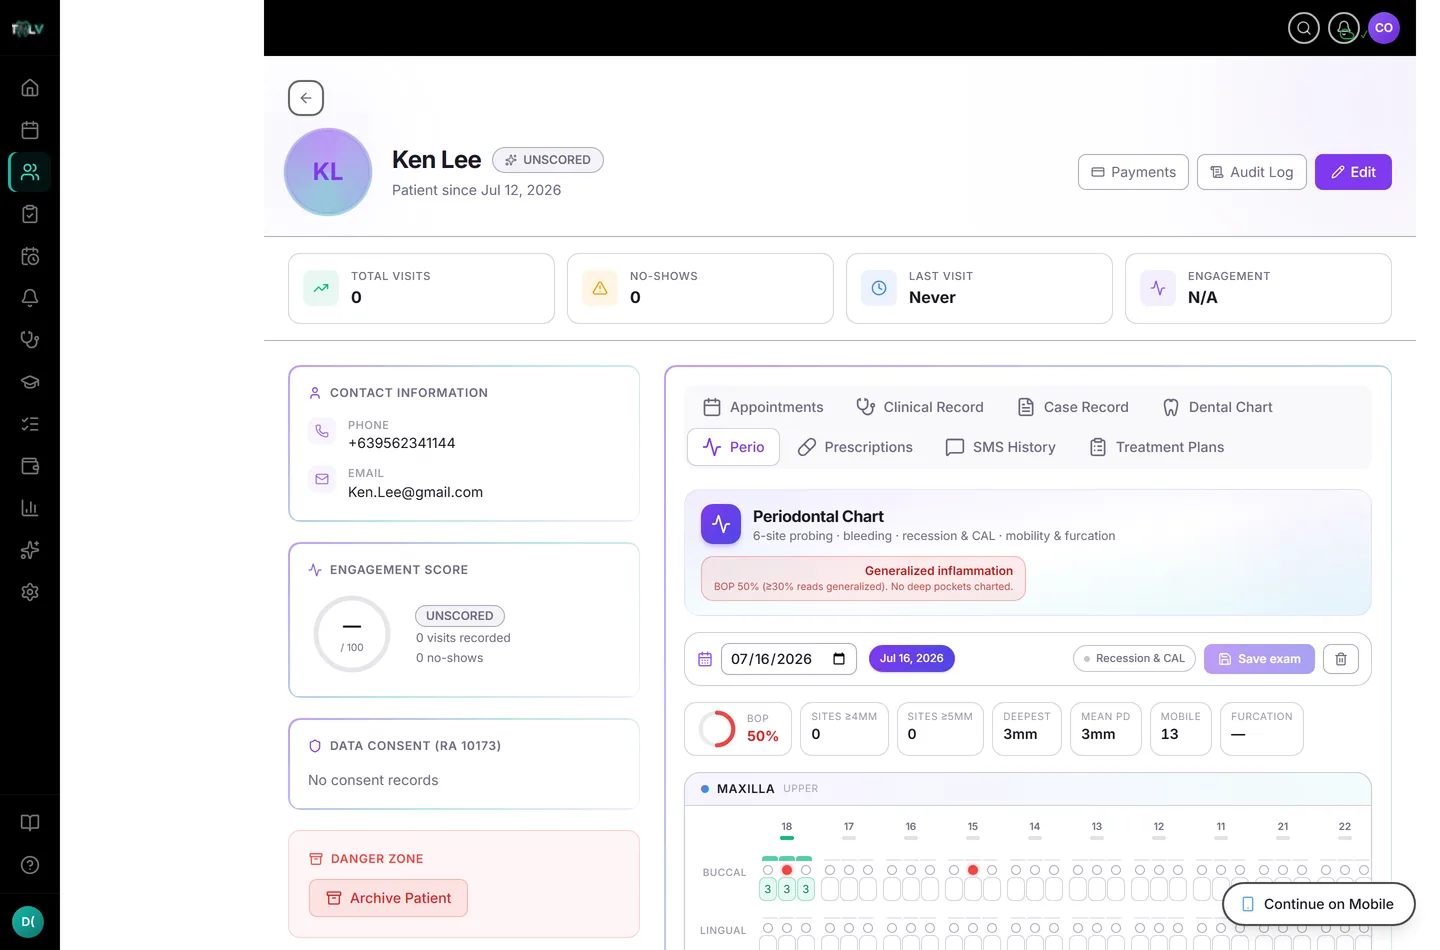
- Generalized inflammation — BOP 30%+ across the mouth.
- Deep pockets — periodontitis pattern — any site ≥5 mm or CAL ≥5 mm: consider a full perio work-up.
It is deliberately a screening aid, not a diagnosis — real staging needs radiographic bone loss and history, so clinical judgment always prevails.
Tracking Progress Across Visits
Every exam is saved under its date; the date pills beside the picker load any earlier exam with one click. The workflow that pays off: chart a baseline, treat, then re-probe 4–6 weeks after SRP on a fresh date — the chips' trend arrows will tell you at a glance whether pockets shallowed and bleeding dropped, and the exam notes keep the clinical story attached to the numbers.
Was this article helpful?
Need more help? Contact our support team