
Understanding Your Financial Reports
How to read the ROI dashboard, track expenses, generate BIR-compliant invoices, analyze revenue trends, and use Smart Insights for your clinic.
Numbers the Clinic Can Act On
Most small practices know their revenue only as "the bank balance moved." The Financials section replaces that with three live numbers — revenue, expenses, net profit — and the breakdowns that explain them. Access follows roles: owner, Full Access, and Admin (Finance) see money; the front desk deliberately doesn't.
The Overview Tab
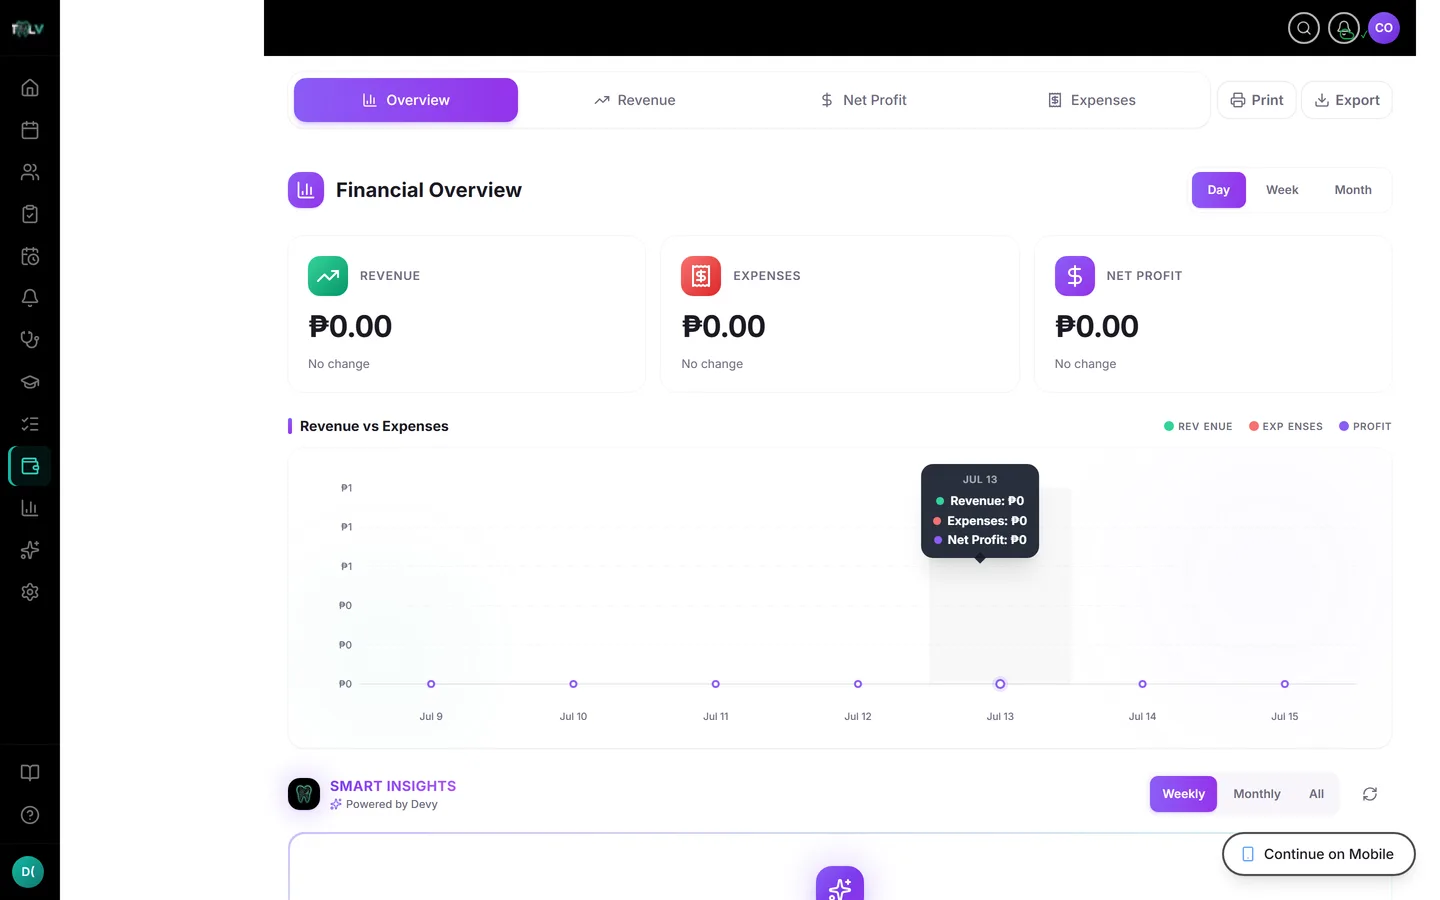
Open Financials in the sidebar. The Day / Week / Month toggle sets the period, and three KPI cards carry the headline: Revenue, Expenses (its trend arrow is inverted — down is good), and Net Profit, each with a percentage against the previous period. Below: the Revenue vs Expenses chart, Devy's Smart Insights, and a Period Breakdown table with totals. Every tab carries Print and Export (PDF) buttons — board-meeting-ready without a spreadsheet.
Most revenue arrives automatically from completed appointments and procedures — which is why marking visits Completed promptly isn't pedantry; it's what keeps this page true. The Revenue tab charts income over time, breaks it down by service, and accepts manual entries for anything outside the appointment flow.
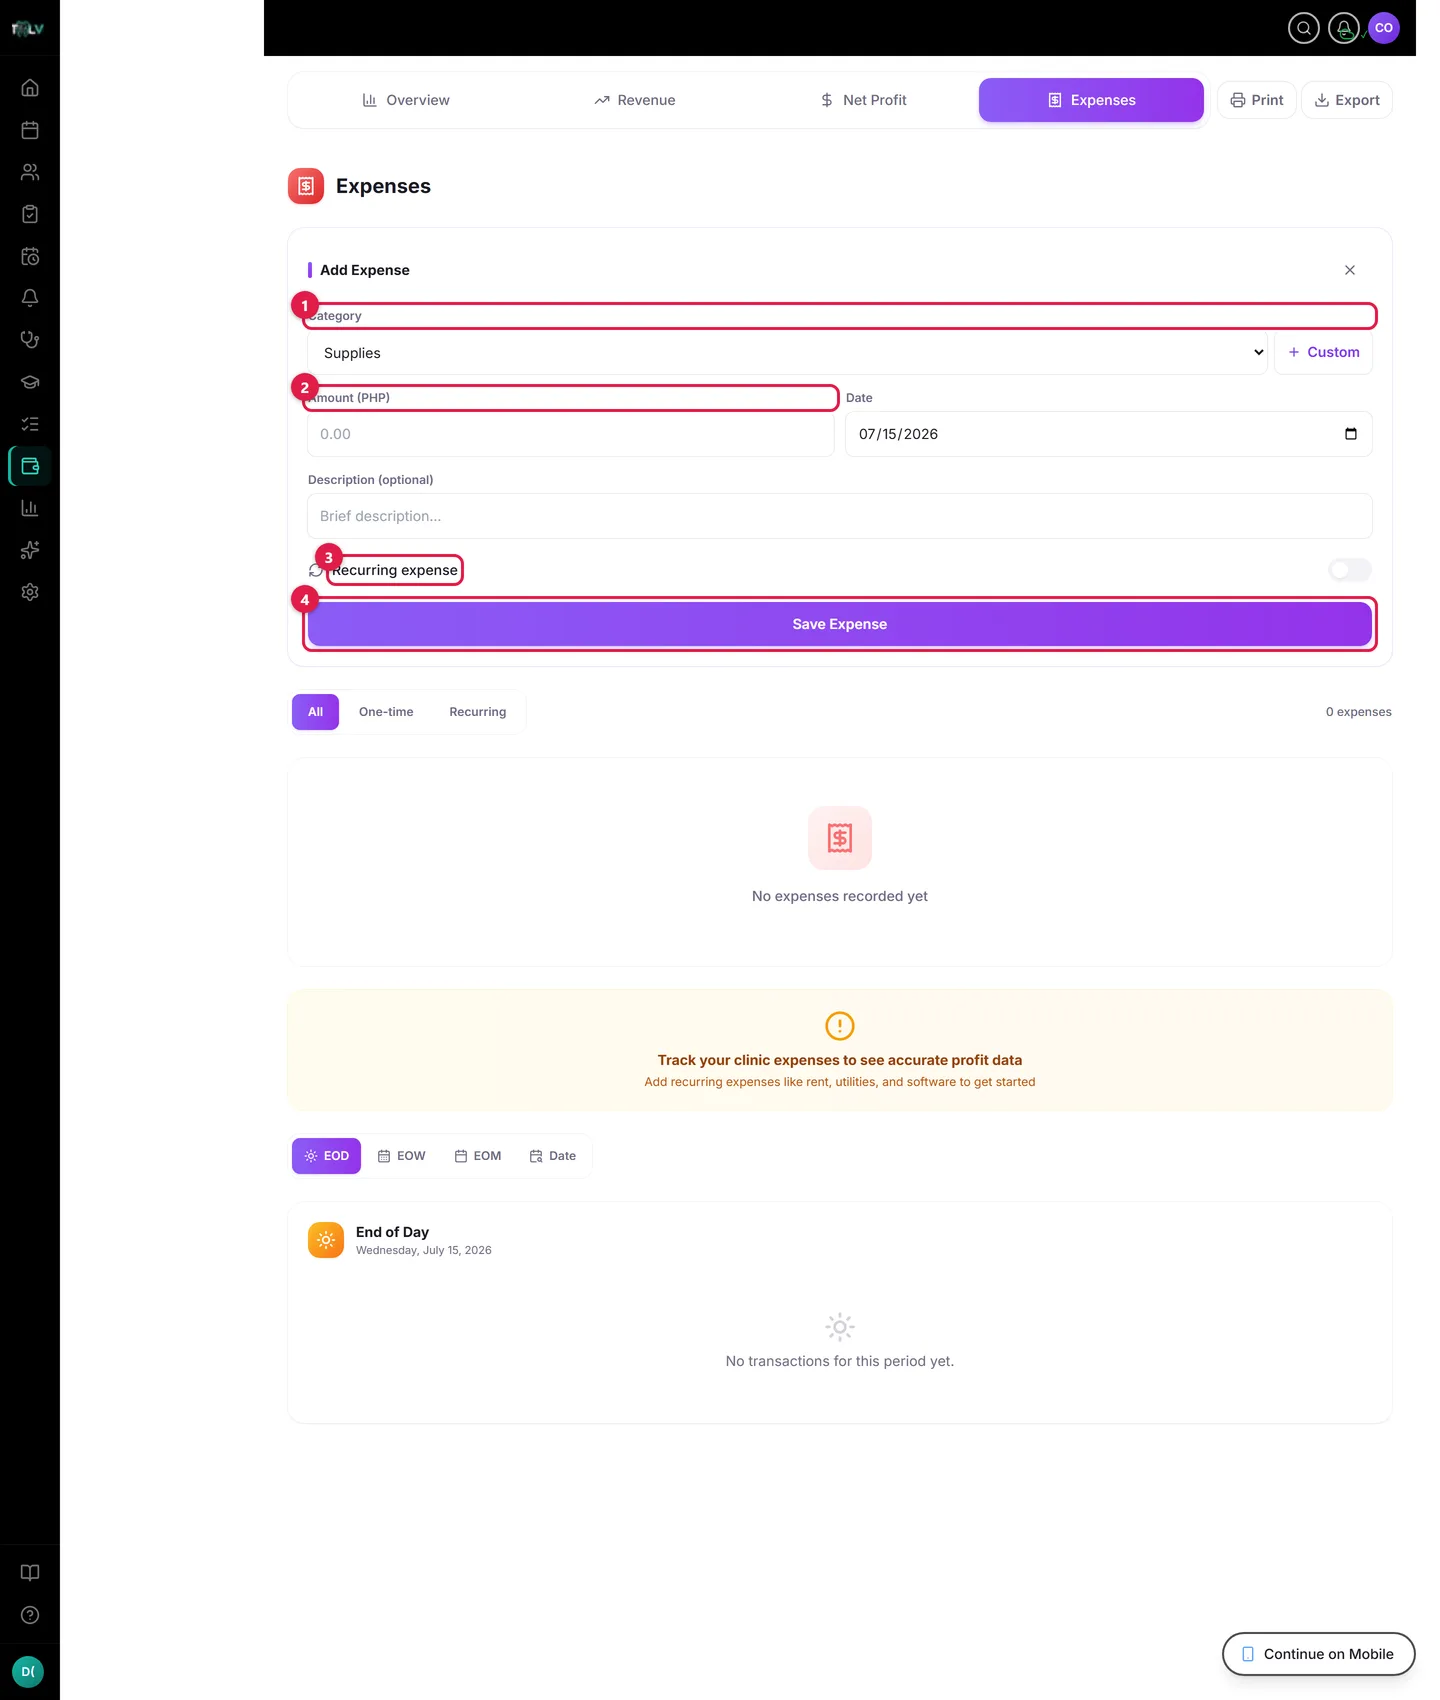
On this form: ① Category — pick a preset (Supplies, Rent, Utilities, Salary…) or type a custom one; categories power the breakdown chart. ② Amount (PHP) — the amount spent; entries of ₱10,000 or more wait for the owner's approval badge. ③ Recurring expense — for rent-like costs; choose Monthly, Quarterly, or Annual and DentalView auto-generates each period (owner only). ④ Save Expense — records it into your financials immediately.
Recording Expenses, Step by Step
- Open the Expenses tab and click Add.
- Pick a Category — Supplies, Rent, Utilities, Salary, Equipment, Software, Insurance, Marketing, Maintenance, Other — or type a custom one. Categories power the breakdown chart, so consistency beats creativity.
- Enter the Amount (PHP) and Date, plus an optional description.
- For rent-like costs, switch on Recurring expense and choose Monthly, Quarterly, or Annual — DentalView then generates each period's entry automatically (owner-only, and each generated child is badged "Auto-generated").
- Save Expense.
Two governance details: expenses of ₱10,000 or more wait for the owner's approval (a "Pending Approval" badge until the shield icon is clicked) — a light four-eyes control on big spends; and your DentalView subscription records itself as an expense automatically ("Auto-recorded"), one less thing to remember.
Reading the Expense Analytics
The Monthly Recurring card is your fixed-cost floor — the number revenue must clear before profit exists. Expenses by Category shows where money actually goes, and the Expense Breakdown table compares each category against last month, green for decreases, red for increases. A rising Supplies line with flat patient volume is the classic early catch: someone's ordering habits changed, and this table is where you notice.
Activity, Digest, and ROI
The Reports page carries the operational siblings: Activity Reports (appointments, show-ups, no-shows, reminders — daily, weekly, monthly, with history), the Daily Digest archive of end-of-day snapshots, and Performance & ROI — the report that compares your current no-show rate against your baseline and estimates the peso value of prevented no-shows. Two prerequisites make ROI meaningful: a baseline no-show rate (from onboarding, editable later) and real service prices, since savings are computed from what a kept appointment is worth.
A Five-Minute Monthly Ritual
Month's end: open Overview on Month, read the three KPIs against last month, glance at the category breakdown for red rows, and export the PDF for your records. Five minutes, and the clinic's finances have an owner who actually looks — which, at most small practices, is the entire difference.
Was this article helpful?
Need more help? Contact our support team